
Student Loan Data Visualization
Challenge
Most users enrolled in the program once and never came back.
Goal
Create a reason to return by helping users understand their loans and take meaningful action.
Role Lead Product Designer
Industry Fintech, Employer HR Benefit
Timeline ~10 weeks (MVP), extended iteration post-launch
Tools Figma, Mouseflow, Google Analytics
The Problem
What we learned:
Users felt confused, overwhelmed, or emotionally detached from their loans.
They didn't know what to do after logging in.
50% saw it as automatic, out-of-sight/out-of-mind.
25% were overwhelmed, 25% were taking proactive steps—but lacked tools.
Quote:
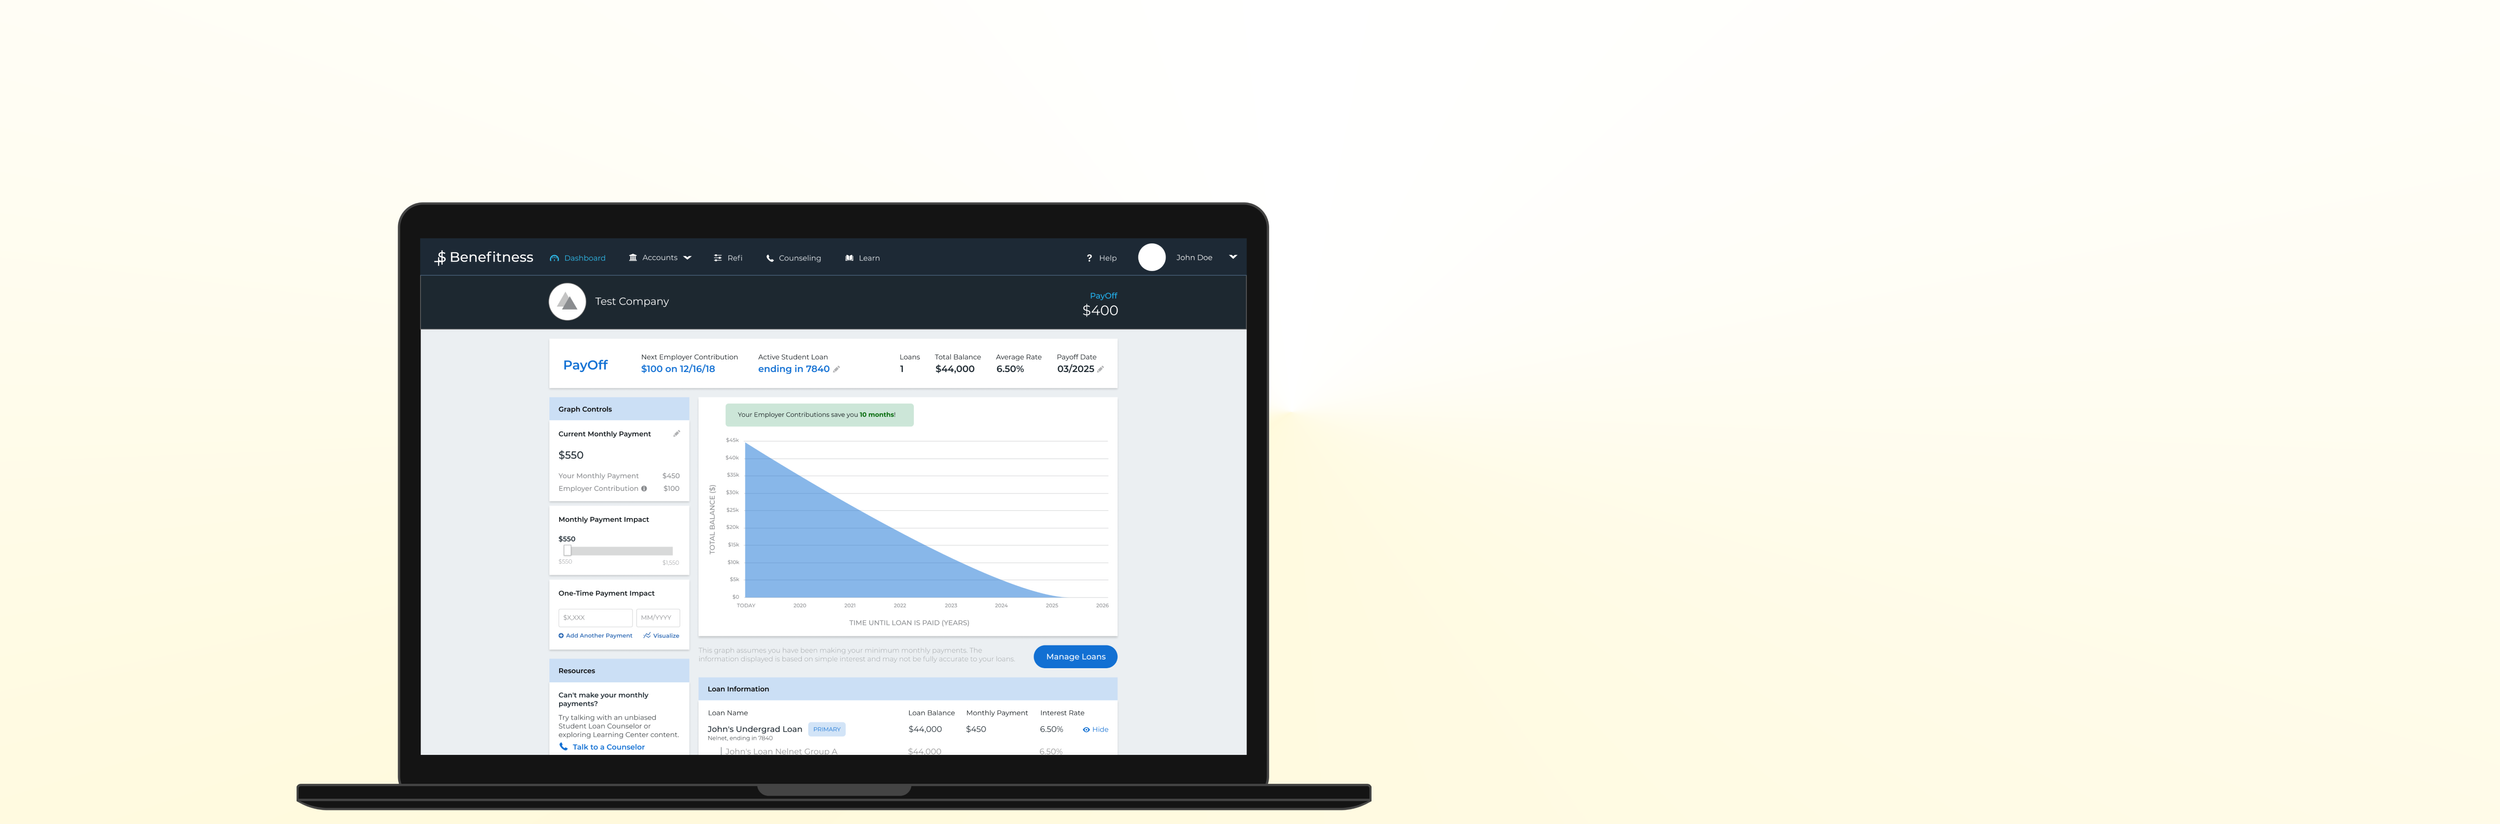
“It’s like what my loan servicer’s site aspires to be.”


Pulse check on our users
“The most common question we hear is, ‘Should I invest in retirement or pay off loans’?”
“More options than there were years ago: income-driven repayment plan, public service loan, forgiveness, Refinancing, Consolidating, Forbearance”
“Users feel embarrassed, stressed, frustrated, and that talking to us is their last resort”
— ASA Counselors
42.27% of our members have increased their monthly loan payment since they started receiving their employer’s PayDown contributions.
53.63% of members feel that their PayDown contribution has eased their stress about student loan payments
74.12% of members are happier at their company because they offer a Student Loan PayDown Plan.
— Employee satisfaction survey
(n=537)
“"Missing those payments destroyed my credit score“
"Loans are a monster you never want to touch“
“Fun to see the numbers drop each month"
"I'll deal with this later, knowing I'd consolidate and refi [my loans] after [the contribution program benefit"]“
“Which I had been more thoughtful about it"
— User Interviews
(n=5)